Updates from Belen Toggle Comment Threads | Keyboard Shortcuts

  • Belen 12:41 am on March 4, 2020 Permalink  

    Generating charts using Image-Charts and QuickChart 

    As we have shown in previous posts, you can use the keyword *chart to dynamically generate charts inside your GuidedTrack program. There are currently three types of charts you can create: bar, scatter and line. On those occasions when *chart doesn’t meet your needs, you may find Image-Charts or QuickCharts useful.

    Image-Charts is quite easy to use! All you need to do is generate a URL with parameters that contain the information about the chart that you want. You can then use this URL as an image to display:

    *image: https://image-charts.com/chart?chs=700x190&chd=t:60,40&cht=p3&chl=Hello%7CWorld

    Some basic parameters in Image-Charts are:

    • cht: Used to indicate the type of chart to display. The types currently offered are bar, line, pie, polar, radar and bubble charts as well as QR codes
    • chd: Data points to plot
    • chs: Size (in pixels) of the generated image
    • chl: Labels

    The documentation of the tool is very easy to follow and there are plenty of examples. They also provide a form that you can use to generate the URL.

    We have created a sample program so that you can see how it works. It uses data gathered from a brief questionnaire and displays three cool graphs:

    You can look at the code of the program here.

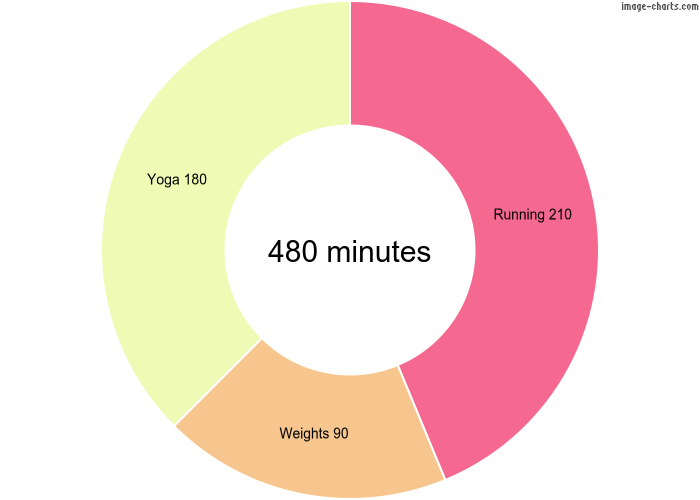
    Let’s examine the code that generates the doughnut chart:

    Here we have first created variables that are set to the values of the parameters that will be sent in the URL, which makes our code easier to read and debug:

    • Chart type: “pd” (pie doughnut)
    • Data points: The minutes the user spent running, doing weights and doing yoga last week
    • Image size: Entered in pixels
    • Legend and labels: These parameters are used in different ways depending on the chart type, so refer to the documentation or the URL generator if you need help defining your own

    We then build the URL and it is ready to display!

    When generating charts with QuickCharts, we also use a URL but in this case it looks like this:

    *image: https://quickchart.io/chart?bkg=white&w=500&h=300&c={type:'bar',data:{labels:[2012,2013,2014,2015,2016],datasets:[{label:'Countries%20Visited',data:[4,7,2,5,8]}]}}

    The base url is https://quickchart.io/chart and in the example shown we are setting 4 parameters:

    • bkg: background color
    • w: width
    • h: height
    • c: a chart.js object with all the data needed to plot the chart

    QuickCharts has a lot more types of graphs and options than Image-Charts so building the chart.js object may get complicated. There is a sandbox on their website with a sample object that you can modify to generate your own. When you are done, you will need to URL-encode it to pass it as parameter “c”. Refer to the documentation to see all the types of graphs available and the different options.

    Below is the code we have created to depict the exponential growth of a colony of rabbits using a logarithmic scale:

    *image: https://quickchart.io/chart?bkg=white&c={type:'line',data:{labels:[2012,2013,2014,2015,2016],datasets:[{label:'Rabbits',data:[98,212,510,739,1434]}]},options:{scales:{yAxes:[{id:'first-y-axis',type:'logarithmic'}]}}}

    And this is the resulting image:

     
  • Belen 1:18 am on January 10, 2020 Permalink  

    Feature update – new syntax for *wait, custom events 

    Here’s what’s new:

    *wait syntax update

    We have updated the way you tell GuidedTrack how long to *wait. This change will not make your running programs break, but if you edit a program that contains this keyword you will get an error message prompting you to use the new syntax. 

    In the example below, the program waits 4 seconds before displaying the button:  

    Basically, now there is a period between the number and the word “seconds” or “minutes”. The changes we have made now allow you to:

    WAIT A FRACTION OF A SECOND
    Do you want your program to display an image exactly for 0.7 seconds? Just enter it!

    USE VARIABLES TO SPECIFY DELAYS
    You do not need to set the wait time when writing your program, it can be generated at runtime. In the example below, the user enters the number of seconds to wait:

    WAIT A COMBINATION OF MINUTES AND SECONDS
    If you know how many minutes and seconds you want your program to wait, you can do the conversion to seconds or skip it and write it this way:
    *wait: 2.minutes + 4.seconds

    WAIT FOREVER
    This is especially useful when your program has navigational elements other than questions and buttons – i.e. when you are using the keyword *navigation or clickable *components.  Using *wait without any duration will stop the navigation indefinitely (without ending the run of the program) until a navigation element or *component is clicked. See the syntax below:

    This is how this program looks, and this is what it looks like without *wait.

    Custom events

    We introduced the keyword *events with the attribute *startup to have your GuidedTrack program do something every time that a user returns to it. Now we have enhanced its functionality so that you can trigger custom events using JavaScript. This is a super powerful tool that allows you to control the program navigation using events and even send data from JavaScript to GuidedTrack. 

    This feature is only for when embedding your program on a website and you will need to have a working knowledge of HTML and JavaScript.

    Here is a simple program that uses custom events:

    The program above has an event called “loadFinalPage”. In order to trigger this event, you would have a script in the page where the program is embedded that would look like this:

    jQuery(window).trigger(‘loadFinalPage’, {“message”:”going to final page”, “message2″:”because a button was clicked”})

    Note that the event’s name in the JavaScript code matches the name in your program!

    When the JavaScript event occurs, the GuidedTrack code under the event runs immediately. See also how the JavaScript code passes an array of data that gets stored in the association it so that you can read this data from within the program. So, if the event loadFinalPage is triggered as shown above, the sample program will display message1 and message2 and then go to the label final_page no matter where the navigation was at that point.

    Also, know that your program can have different events, you just need to create them as shown above.

     
  • Belen 10:53 pm on September 10, 2019 Permalink  

    Feature Update – Program Library, *html, GuidedTrack syntax highlithers and using Mailchimp from your program 

    Here’s what’s new:

    Program Library

    The Program Library is a collection of programs we have created so that you can use them from your own using the keyword  *program.

    These are a few examples of the programs that are available:

    • Widely used measures covering personality, mental disorders, substance use and more:
      • Ten Item Personality Inventory (TIPI), IPIP-NEO-120, IPIP-HEXACO
      • PHQ Screeners, CAGE-AID Questionnaire, DASS-21, PTSD Checklist – PLC-5, Eating Disorder Diagnostic Scale, Levenson Self-Reported Psychopathy Scale
      • Van Westendorp Price Study, Bongard Problems, memory tests
    • Screening and demographic questions: list of countries, US States, education level, income, religiousness, political affiliation, employment
    • Mathematical operations: truncate, round, random number generator, factorial, binary conversion, temperature conversion
    • Text functions: lowercase and trim text, text comparison, URL encoding, email validation
    • Date handling: current date, day of the week calculation, current time conversion to Eastern Time
    • Display programs: display a collection as a table, display a list of items for the user to rank, cute animal pictures

    Let’s say you are preparing a study to find out if it is possible to know something about a person’s personality by asking them if they like cheese or not. You will need to ask the participants if they like cheese and measure certain personality traits -for example, the Big Five. Here the Program Library comes in handy: instead of you coding a personality scale, why not use one of the measures we have already created?

    Use the search bar to find the scale you need by entering its name if you know it, or browsing by keywords. Search results that are programs from the library are labeled as such. Click on one of them and you will see a modal like this:

    The modal displays the code needed to use this program from your own – which you can automatically insert by clicking on the Insert button on the lower right corner. Additionally you can see the Code of the program and run it in Preview mode to see what it does. You can also create your own copy of any program in the Library to make changes and customize it to your needs.

    Notice that there are some programs that require you to assign value to some variables in order to run: if you want to make a text lowercase, you need to let the program know what the text is. The generated code will guide you in populating these variables, just substitute the sample value we give you for the actual one:

    As you can see, preparing a study to test your cheese/personality hypothesis is now easier than ever!

    Insert *html code in your program

    You can add cool formatting to the things you display on your program using this new feature. The syntax is simple: just indent the html code under the keyword *html.

    For example, you can display headers with different sizes:

    When you run the code, this is what you see…

    You can also use program variables in your html code! Check out this code:

    In fact, if you want to display a collection of collections as an html table, you don’t even need to write the code -we’ve done it for you. It is this program of the Program Library. Use it as is, or copy it to tweak the design of the table it displays.

    These are just two possible uses of this keyword, but you will find more as you write your programs. Just remember that the html code has to be W3C compliant, otherwise there will be an error message when running your program.

    Access your Mailchimp account from a GuidedTrack program

    If you use Mailchimp to manage your mailing lists, you can access it from your GuidedTrack program using *service. This means that when someone running your program gives you their email address, you can automatically add it to your Mailchimp audience. Additionally, you can access subscribers’ information and update it based on the program they use or the data they enter into it.

    Learn here all about accessing your Mailchimp account from your programs.

    GuidedTrack syntax highlighters

    If you use a code editor or an IDE (such as Sublime or Atom) to write your GuidedTrack programs, you can download a handy syntax highlighter so that your code appears in color similar to that on GuidedTrack.com!
     
c
compose new post
j
next post/next comment
k
previous post/previous comment
r
reply
e
edit
o
show/hide comments
t
go to top
l
go to login
h
show/hide help
shift + esc
cancel