Generating charts using Image-Charts and QuickChart
As we have shown in previous posts, you can use the keyword *chart to dynamically generate charts inside your GuidedTrack program. There are currently three types of charts you can create: bar, scatter and line. On those occasions when *chart doesn’t meet your needs, you may find Image-Charts or QuickCharts useful.
Image-Charts is quite easy to use! All you need to do is generate a URL with parameters that contain the information about the chart that you want. You can then use this URL as an image to display:
*image: https://image-charts.com/chart?chs=700x190&chd=t:60,40&cht=p3&chl=Hello%7CWorldSome basic parameters in Image-Charts are:
- cht: Used to indicate the type of chart to display. The types currently offered are bar, line, pie, polar, radar and bubble charts as well as QR codes
- chd: Data points to plot
- chs: Size (in pixels) of the generated image
- chl: Labels
The documentation of the tool is very easy to follow and there are plenty of examples. They also provide a form that you can use to generate the URL.
We have created a sample program so that you can see how it works. It uses data gathered from a brief questionnaire and displays three cool graphs:
You can look at the code of the program here.
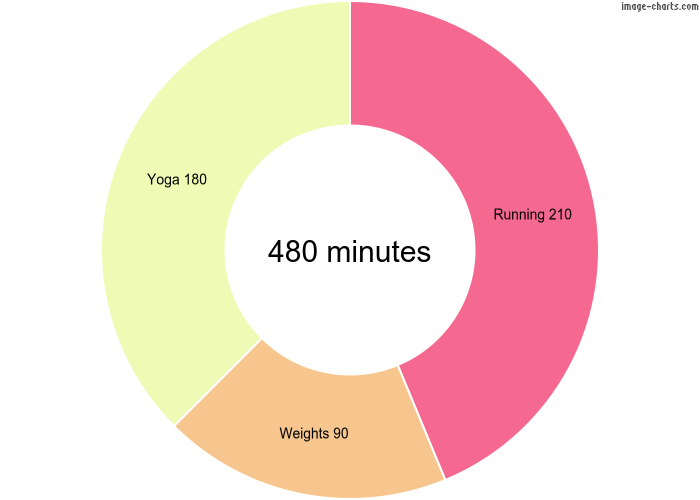
Let’s examine the code that generates the doughnut chart:

Here we have first created variables that are set to the values of the parameters that will be sent in the URL, which makes our code easier to read and debug:
- Chart type: “pd” (pie doughnut)
- Data points: The minutes the user spent running, doing weights and doing yoga last week
- Image size: Entered in pixels
- Legend and labels: These parameters are used in different ways depending on the chart type, so refer to the documentation or the URL generator if you need help defining your own
We then build the URL and it is ready to display!

When generating charts with QuickCharts, we also use a URL but in this case it looks like this:
*image: https://quickchart.io/chart?bkg=white&w=500&h=300&c={type:'bar',data:{labels:[2012,2013,2014,2015,2016],datasets:[{label:'Countries%20Visited',data:[4,7,2,5,8]}]}}The base url is https://quickchart.io/chart and in the example shown we are setting 4 parameters:
- bkg: background color
- w: width
- h: height
- c: a chart.js object with all the data needed to plot the chart
QuickCharts has a lot more types of graphs and options than Image-Charts so building the chart.js object may get complicated. There is a sandbox on their website with a sample object that you can modify to generate your own. When you are done, you will need to URL-encode it to pass it as parameter “c”. Refer to the documentation to see all the types of graphs available and the different options.
Below is the code we have created to depict the exponential growth of a colony of rabbits using a logarithmic scale:
*image: https://quickchart.io/chart?bkg=white&c={type:'line',data:{labels:[2012,2013,2014,2015,2016],datasets:[{label:'Rabbits',data:[98,212,510,739,1434]}]},options:{scales:{yAxes:[{id:'first-y-axis',type:'logarithmic'}]}}}And this is the resulting image:

